Why Predictions of When the Price of Rent Will Fall Have Been Wrong
Economists and others have been predicting monthly increases in rent would stall or fall for two years. Year-over-year rates are down, but monthly increases are still big.
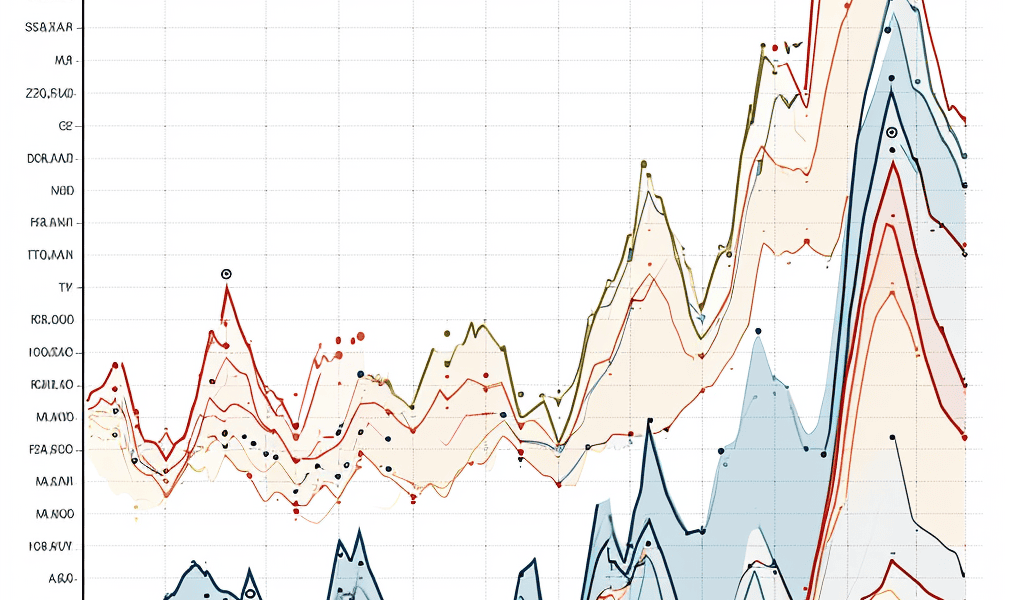
Five measures of year-over-year rent increases, various sources described below, Chart by MishChart Notes
NTR is the New Tenant Rent index from the Cleveland Fed. Lower and Upper are confidence bounds. These are new leases only.
CPI rent is Rent of Primary residence as measured by the BLS. These are new and existing leases.
OER is Owners’ Equivalent Rent a measure of rent for people who own their own houses. The index measures rent of houses unfurnished without utilities. It should and does track Rent of Primary Residence. These are new and existing leases.
Zori is the Zillow Observed Rent Index. These are new leases only.
Apt List is the Apartment List Rent Index. These are new leases only. This index is not seasonally adjusted, the rest are.
Everyone is attempting to calculate when the CPI will head lower based on when rent of primary residence and OER head lower. The idea is based off lead times of new leases.
The BLS smooths things out over 12 months and seasonally adjusts the numbers too. But other than Apartment List, all of the numbers are seasonally adjusted.
Index Peaks
Apartment List: 2021 Q4, 18.10%
Zori: 2022 Q1, 16.27%
NTR: 2022 Q2, 12.15%
OER: 2023 Q1, 8.00%
Rent: 2023 Q1, 8.80%
The CPI measures lag Apartment List by 15 months, Zori by a year, and NTR by 9 months.
So, is the lead time 9 months or 15? More importantly, how much does it matter?
What Percentage of People Move?
Shyft Moving says 9.8 percent move each year.
According to an analysis of 2022 U.S. Census Bureau data published by Brookings, overall migration within the United States was 8.7%.
On the basis on what 9 percent of people do, with peak moving months between Mid-May and Mid-September, economists are attempting to predict rents for the remaining 91 percent of people who stay put.
New leases have been rising at a much faster pace than a blend of new and existing leases.
Apartment List, Zori, and NTR all use methodology that compares the same or similar unit over time. But NTR says the peak year-over-year rate was 12.15 percent while Zori and Apartment List are much higher at 16.27 percent and 18.10 percent respectively.
NTR was created in conjunction with the BLS, using similar methodology.
Only a Decline in Gasoline Prevents a Hot CPI
CPI month-over-month data from the BLS, chart by Mish
On December 12, I noted Rent Jumps Another 0.5 Percent, Only a Decline in Gasoline Prevents a Hot CPIRent, which is sticky, rose at least 0.4 percent for the 28th month.
A Curious Claim that the BLS Is Overstating Rent and Exag


